COAT OF ARMS

This infographic shows the coat of arms' transformation before and after the proclamation of the Italian Republic related to some new towns founded during the fascist regime in the ex pontine marshes. The info design, attached to my book "Agraldica",  shows how the fascist symbols have been replaced to heraldically represent these new cities also born to celebrate the Italian dictator. The info-design explains some basic rules of Italian civic heraldry, how a shield must be designed, and an interesting excursus on the author of the heraldic coat of arms of the province of Latina before and after the fall of the fascist regime.
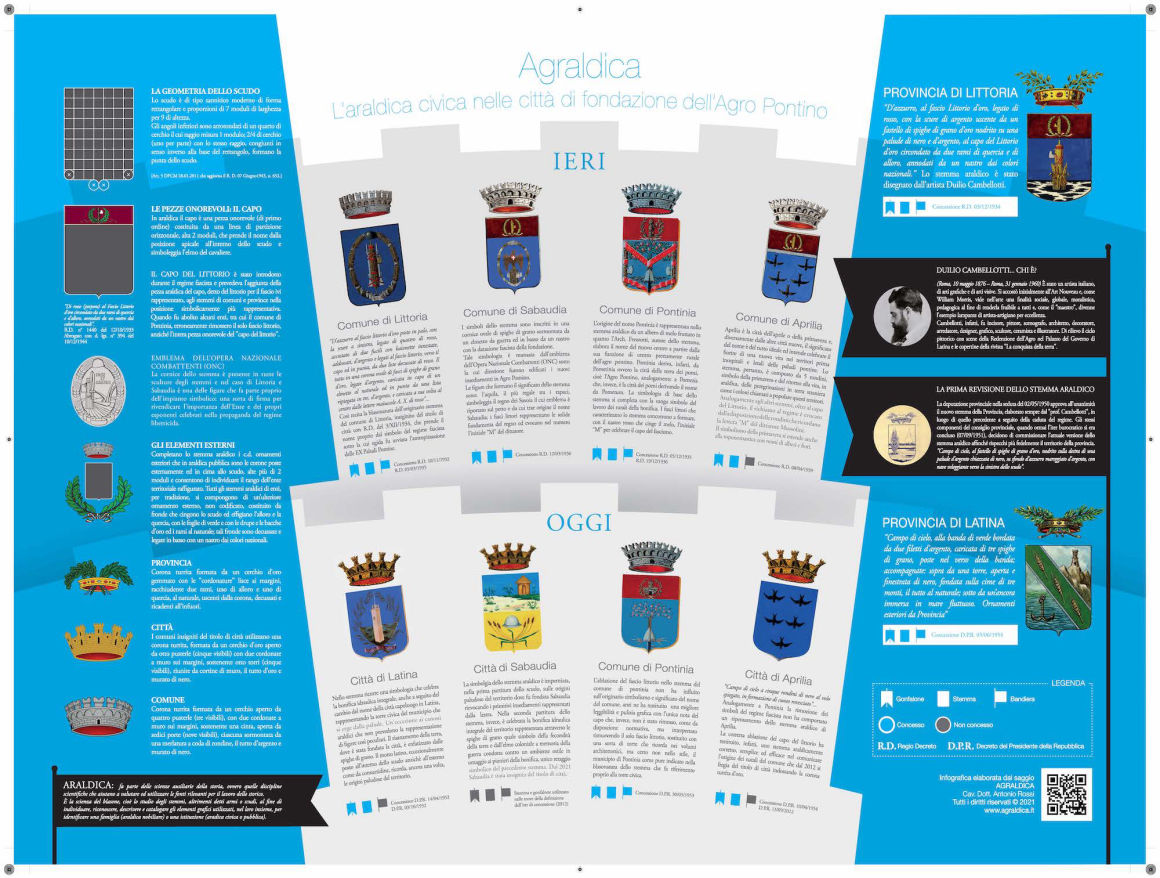
Civic Heraldry Coat of Arms by Antonio Rossi
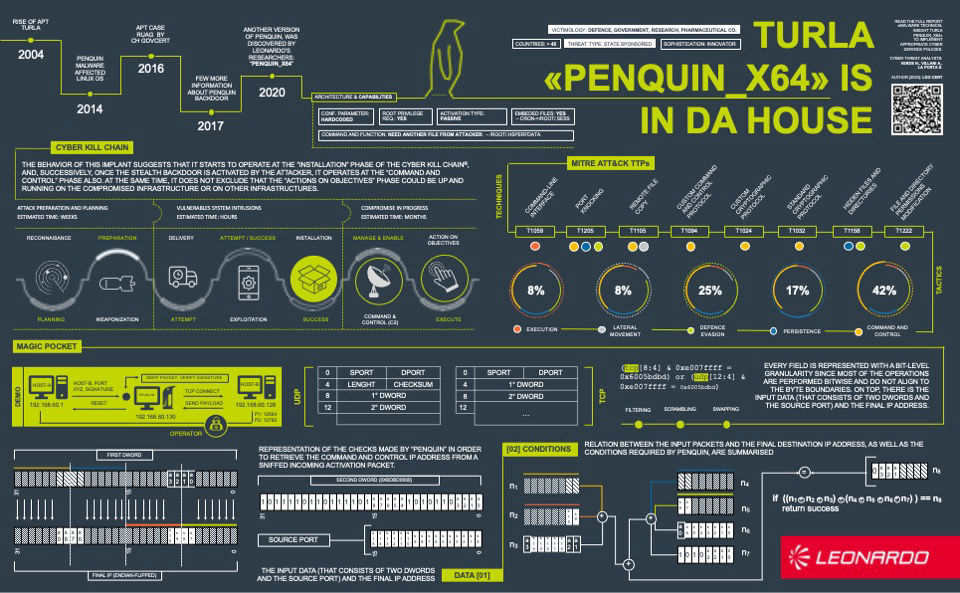
Info-design about new version of malware by Antonio Rossi
MALWARE ANALYSIS

This is my info-design created to explain a new version of Turla's Penquin malware capabilities based on the MALWARE TECHNICAL INSIGHT report by Leonardo's Cyber & Security Division.
The visual approach takes an overview of malware attack patterns and features based on an original aggregated view of the MITRE Attack Matrix TTPs and the Cyber Kill Chain framework.

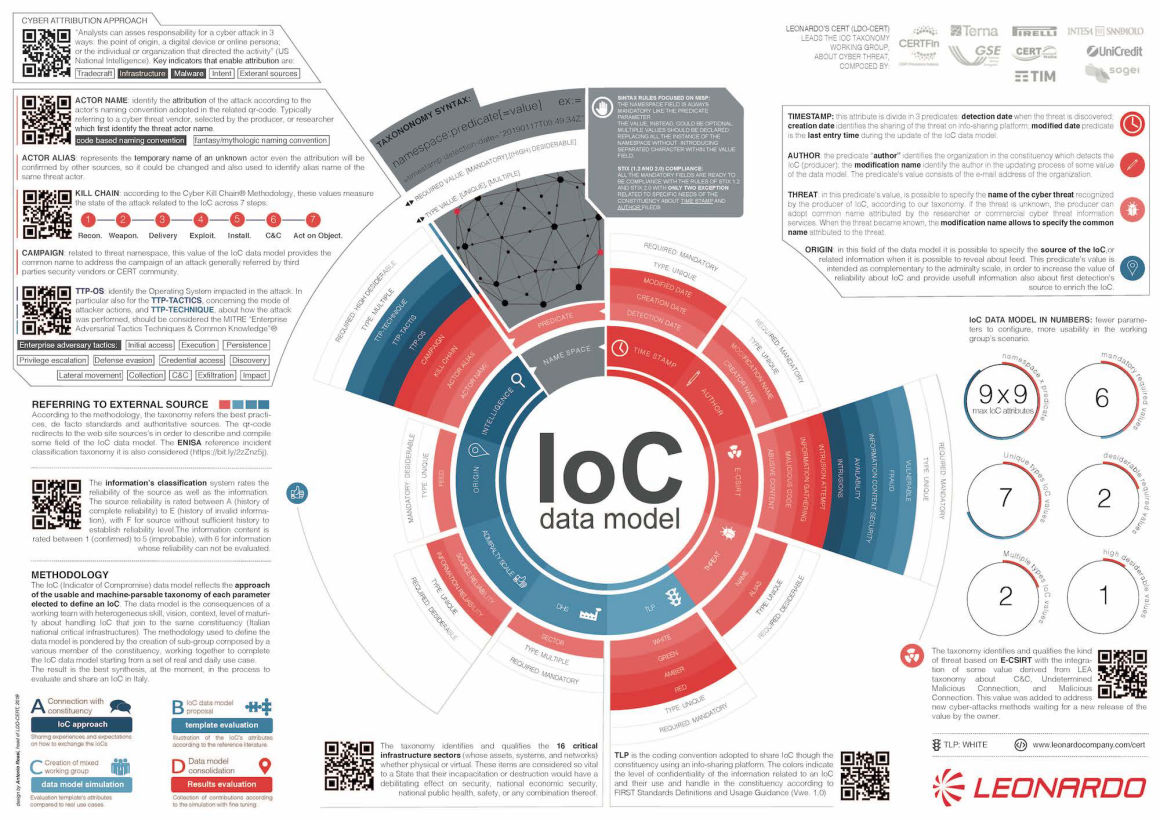
IoC DATA MODEL

My data visualization about the Indicators of Compromise (IoC) Data Model. The data model was developed with other companies and government agencies in Italy to make actionable and usable taxonomy of an IoC based on MISP syntax rules. The goal was to share IoC within the community using a common data model to identify and enrich IoC for producers and consumers. I have designed this poster to explain the taxonomy adopted to share IoC referring to other frameworks used in the security and cyber-security domains. 

Ioc Data Model by Antonio Rossi
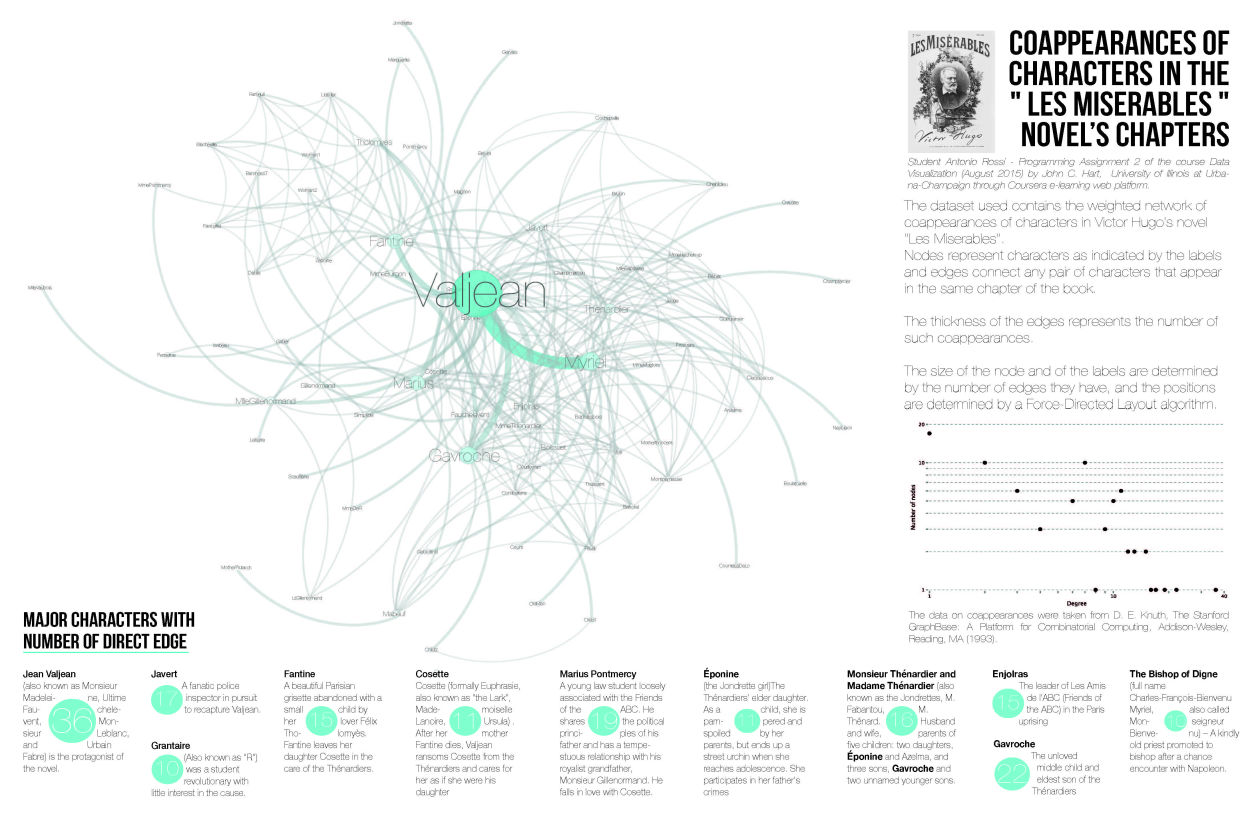
Les Miserables Info Data co-appereance character by Antonio Rossi

Les Miserables Info Data co-appereance character

For fun, I try to demonstrate in this infographic how it is possible to understand a romance using some text parsing algorithm based on stats and A.I. The dataset used contains the weighted network of co-appearances of characters in Victor Hugo's novel "Les Miserables". Nodes represent characters as indicated by the labels and edges connect any pair of characters that appear in the same chapter of the book. The thickness of the edges represents the number of such co-appearances. The size of the node and of the labels are determined by the number of edges they have, and the positions are determined by a Force-Directed Layout algorithm.
So I created a data visualization where the graph shows the primary and significant character of the novelle based on dependences mapping all the protagonists and how they are connected, directly or indirectly, with the protagonist enumerating occurrences, notable places on a separated map and time line. 

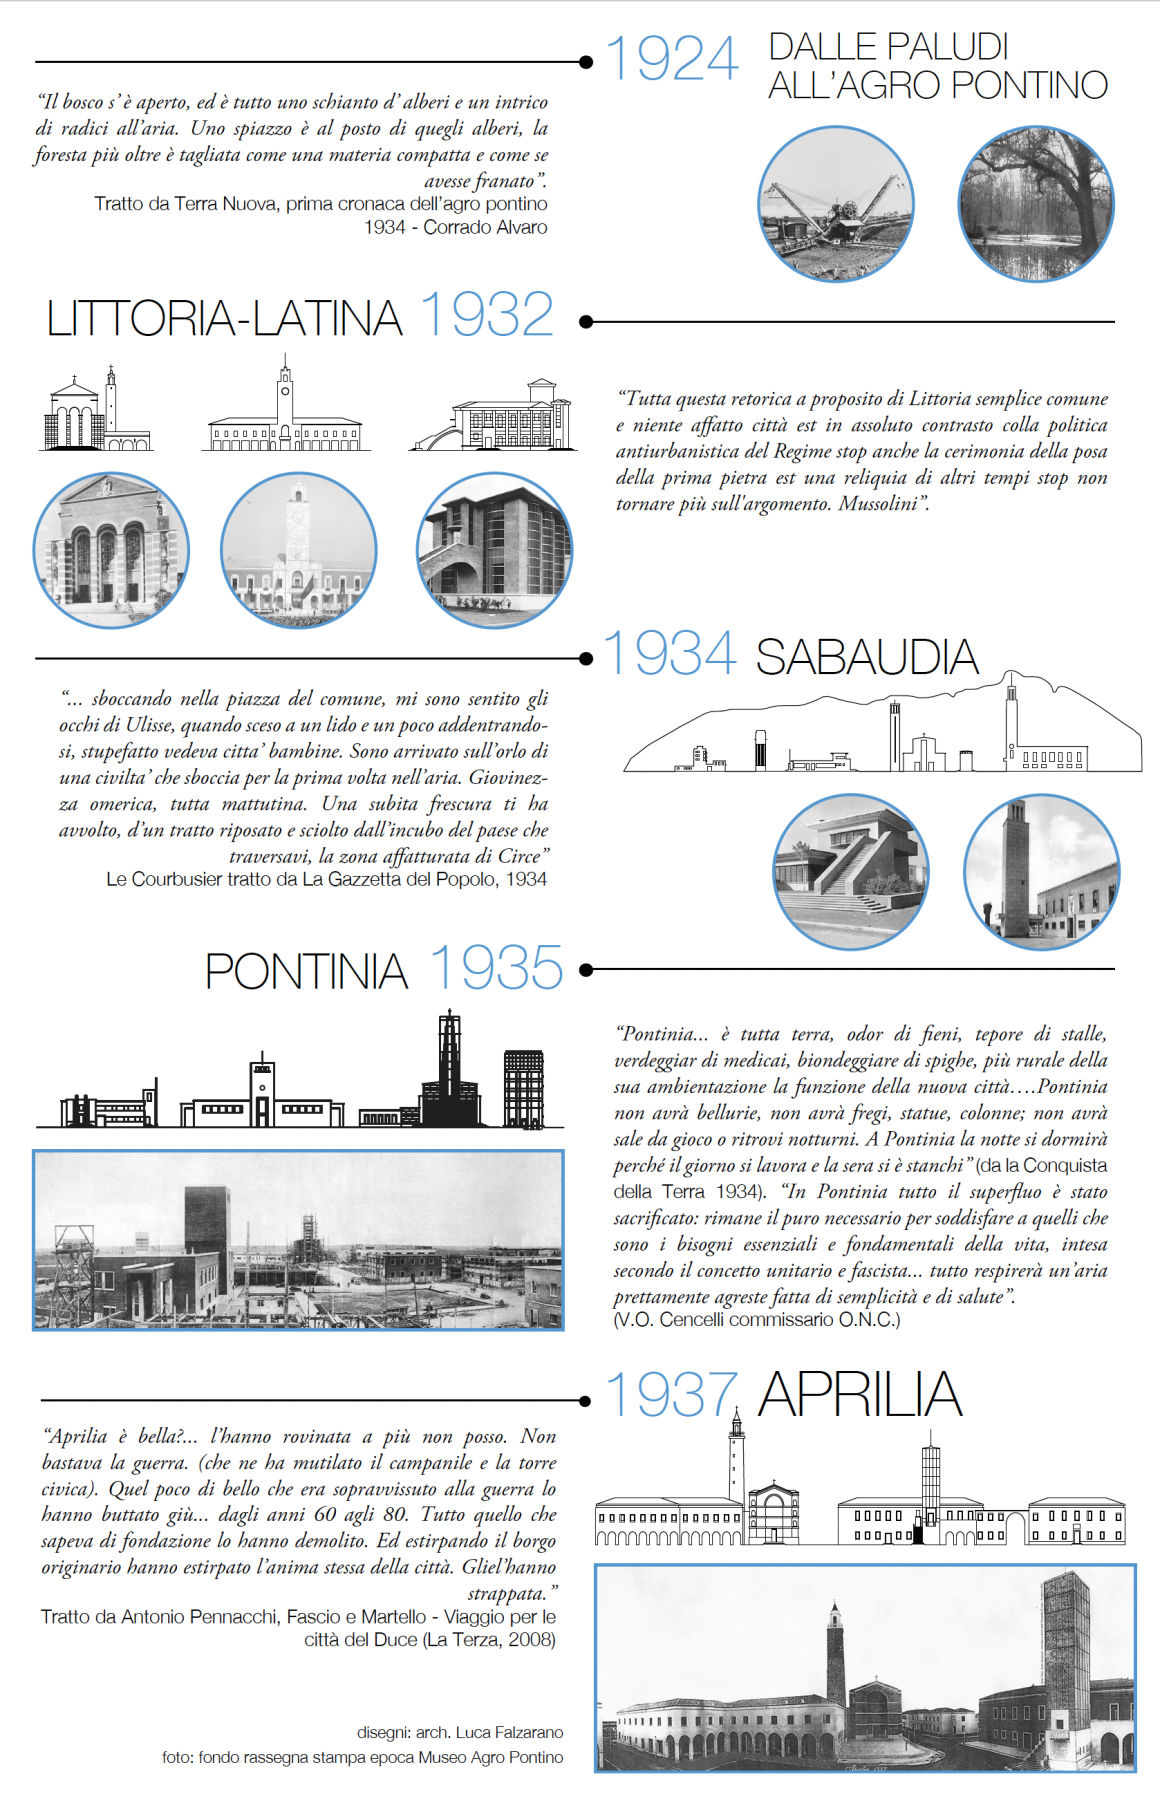
Telling the story of a territory: Agro Pontino

In this infographic, I represented the transformation of the territory: from Pontine marshes to Pontine countryside. In the essential chronology, the most important events of land reclamation and subsequent anthropization are reported, only in Italian.
Short didactic texts also report quotations from imported authors, poets, and writers, who have told and described the state of the places in the Pontine marshes and of reclamation.
Vintage photographs and original illustrations are the graphic elements that help the reader to understand the transformation of the territory and the particular architecture with the visual language.
The information is included in my book Agraldica and identifies the cities I studied from a symbolic and iconographic point of view.

Pontine marshes history infographics by Antonio Rossi

© Antonio Rossi 2022. All Rights Reserved.

Created with Mobirise ‌

Website Design Software